I have continued developing the
project that I presented for the Data Translation assignment. I particularly
wanted to make the project more three dimensional; it now measures 10”x 8”x10”
so is closer to the cube shape that I envisioned. I hope that this might create
associations with a water tank or aquarium since that is where the water
samples that compose the data set are housed in the lab setting. I created a
base that holds eight glass sheets upright: one sheet shows an image of the
data set, one shows a photographic image of the ostracods, and the remaining
six have images of ostracods etched into the glass. Each of the six sheets
represents one of the sample dates shown in the graph. The base is intended to
reference the way that microscope slides are stored. I have attached several photos of the
finished piece.
As I mentioned in other posts and
assignments, I have studied closely with Judit Hersko and I am heavily
influenced by her work, particularly in terms of aesthetics. I have tried to
differentiate this project from her work. In its first iteration, I intended to
use the effects of light and shadow as a component of the piece, but I no
longer plan to incorporate this and it is not an element of this final project.
Overall I am happy with the result. There are a few elements that might change
for this piece: I’m not sure whether I will ultimately include the photographic
image of the ostracods, and I may finish the wooden base differently.
I look forward to continuing with
this work and I know that the techniques I have learned over the semester will
continue to be useful.
Sources:
Bricke, J. (2019). Precipitation
Effects on Population Dynamics of Freshwater Invertebrates
within Temporary Aquatic
Environments. Unpublished MS thesis. University of
California, San Diego, United
States.
Hersko, Judit. (2009). ‘Translating’ and
‘Retranslating’ Data: Tracing the Steps in Projects that
Address Climate Change and
Antarctic Science. University of California, Irvine, United States.
Raylea
Rowbottom, Scott Carver, Leon A Barmuta, Philip Weinstein, Dahlia Foo, and
Geoff R.
Allen. “Resource Limitation, Controphic Ostracod Density
and Larval Mosquito Development.” PLoS
ONE 10.11 (2015):
E0142472. Web.
When identifying either a personal cultural influence or an art historical reference, my original idea was to make a three dimensional object through this cool modeling program known as Tinkercad. Maxwell Shepherd, a smart and bright classmate I have come to known over time, came over to the Data Visualization class one time to show off what he specializes in. While reflecting on this type of artistic form and context, I never really paid much attention to the complexities and beneficiaries that three dimensional modeling can shape an artist’s imagination to another level. There are some neat features that this technological tool offers and I researched both a personal cultural influence and art historical reference that was going to support the object I designed. I wanted to display a treasure box that had found objects collected on my own or personal accessories that had a backstory to them. Considering time management, I came across strong documentation of Mexican folk art plus Mexican muralism. I chose these two artistic movements because of my cultural heritage (I’m Mexican American) and to recognize my ancestors who have passed away before/during my lifetime. I asked Maxwell if I had to pay a fee to get my proposed treasure box three dimensionally printed through the campus library and he had told me at the time that students/individuals in general must ask permission from either the president of the university or one of the high ranking employees underneath the campus hierarchy such as the dean of a college discipline. Whether what Maxwell had told me based on what he had heard is true or not, I could’ve asked Professor Lucy HG Solomon how should I go about working in this direction and if proper permission was needed to get my object printed. Due to four other classes I had been taking this semester, my mind was focused on those priorities over this Data Visualization class at certain times.
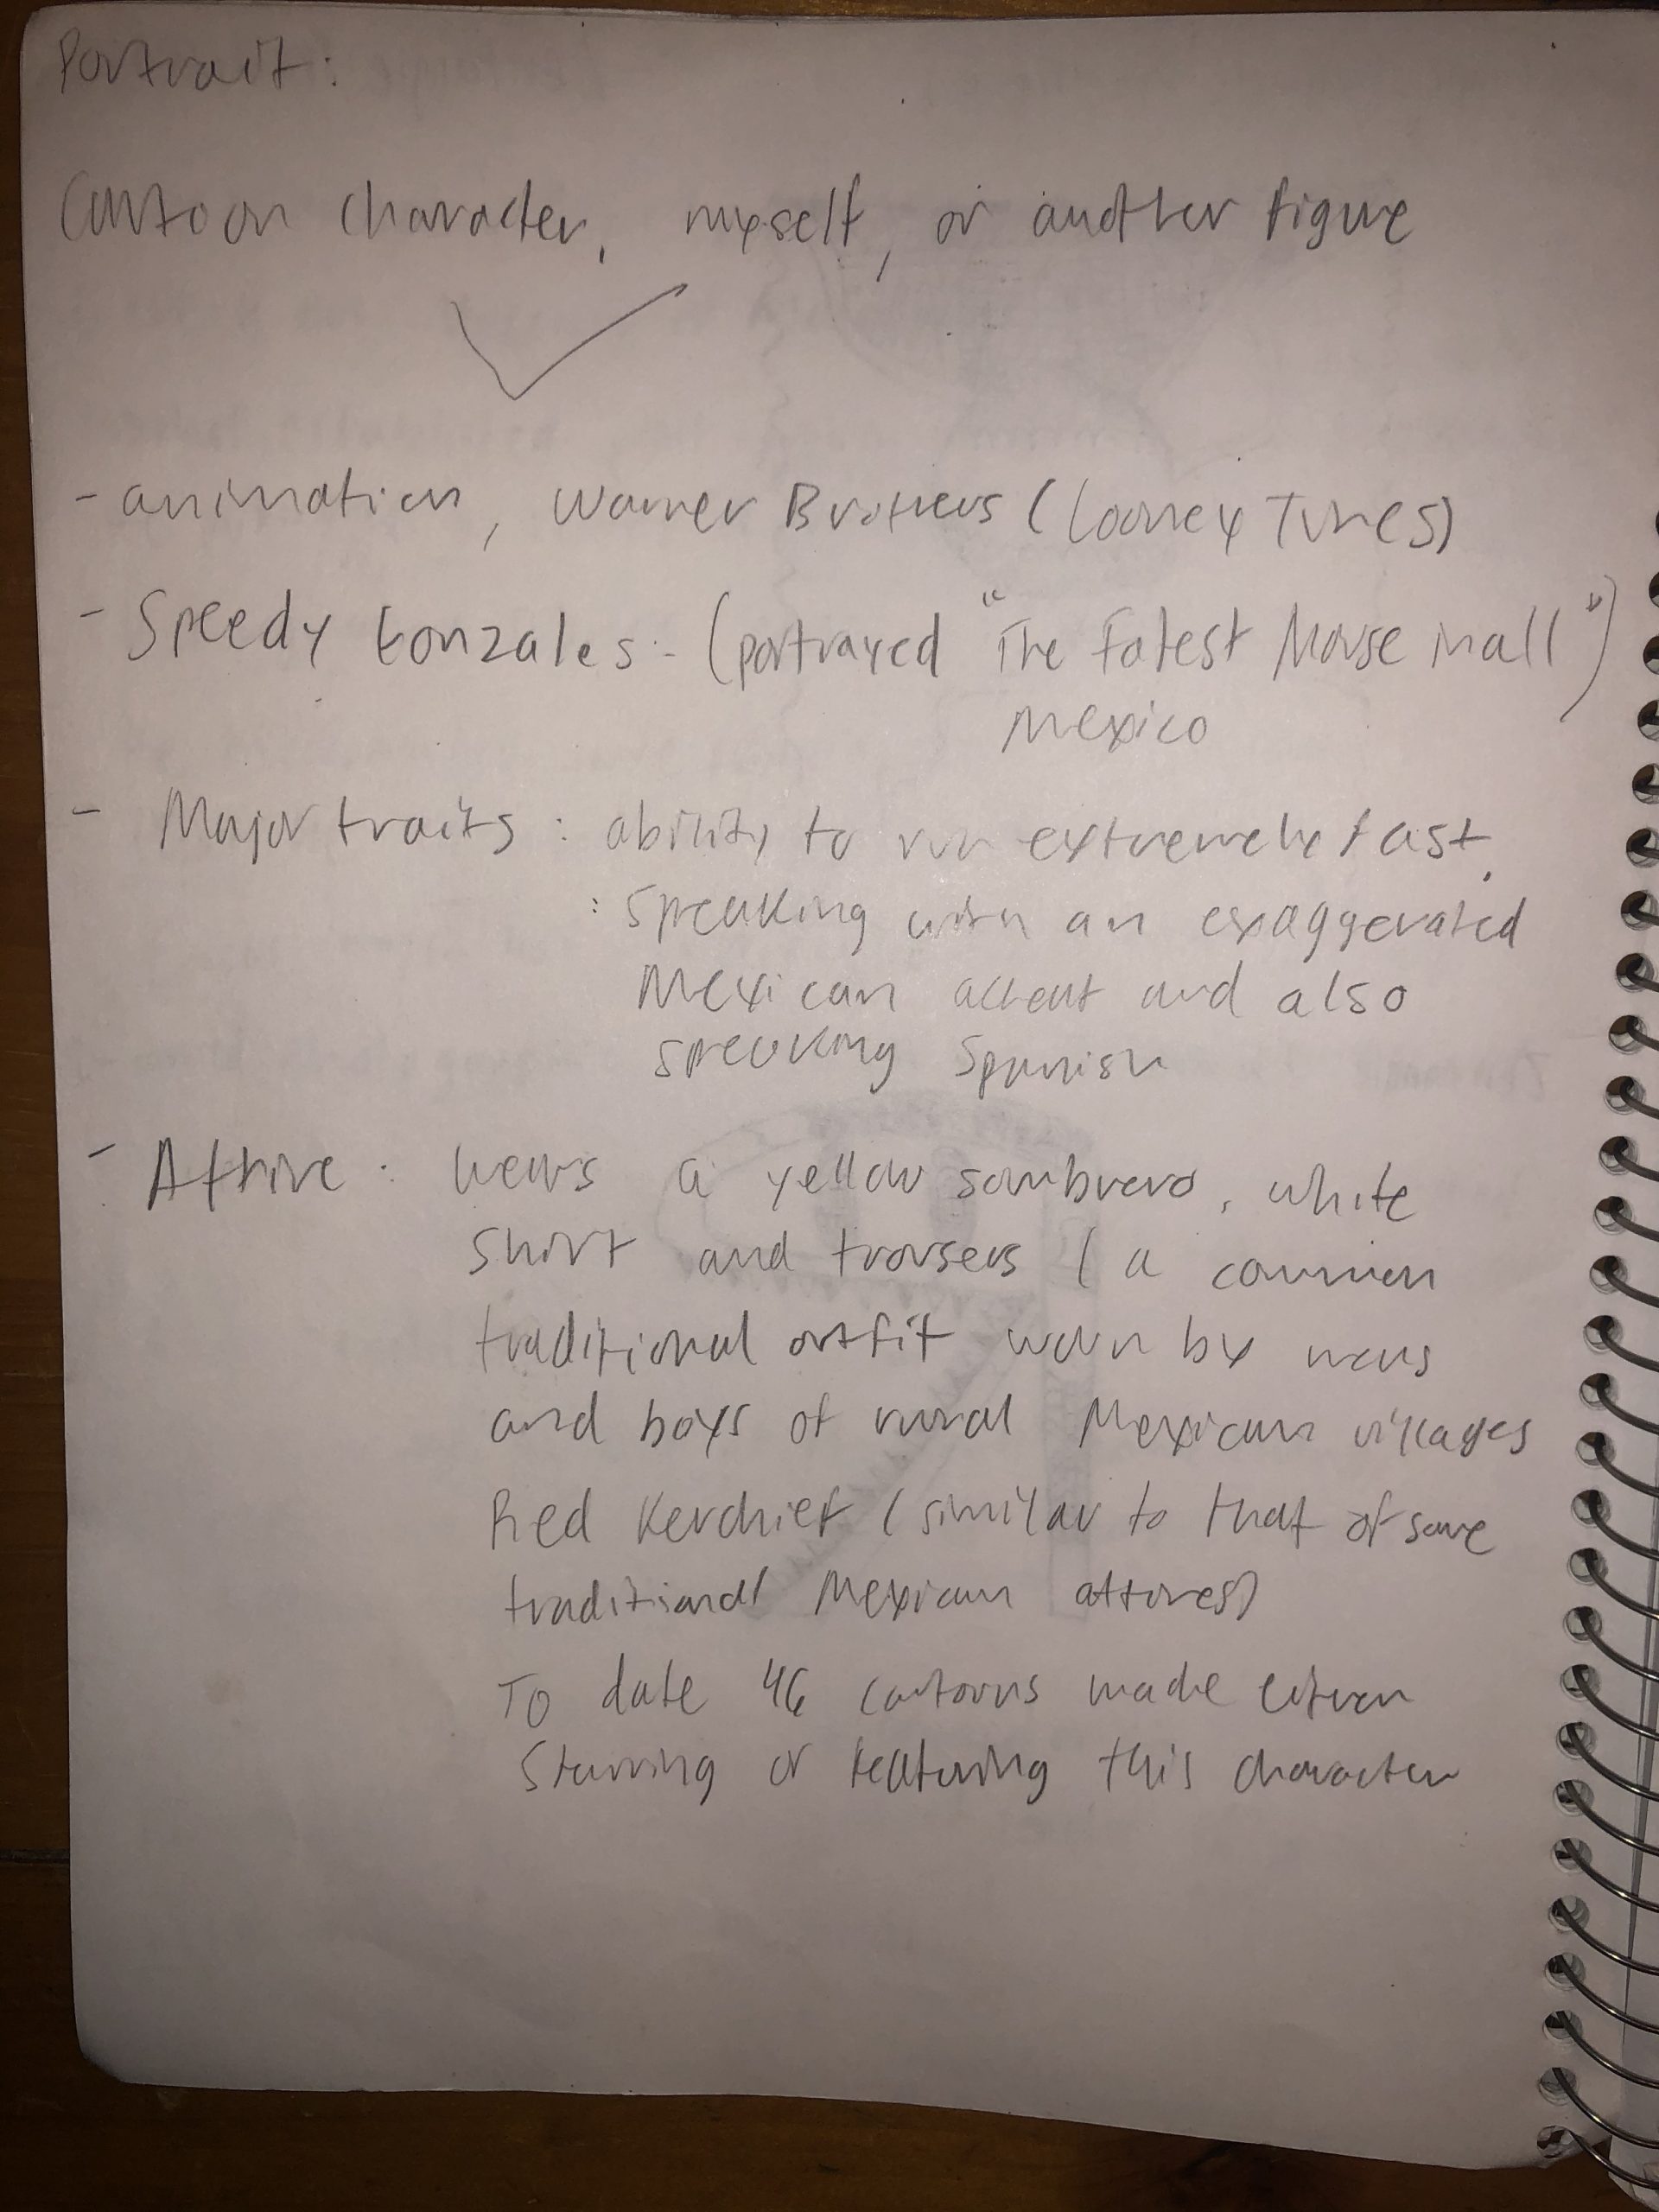
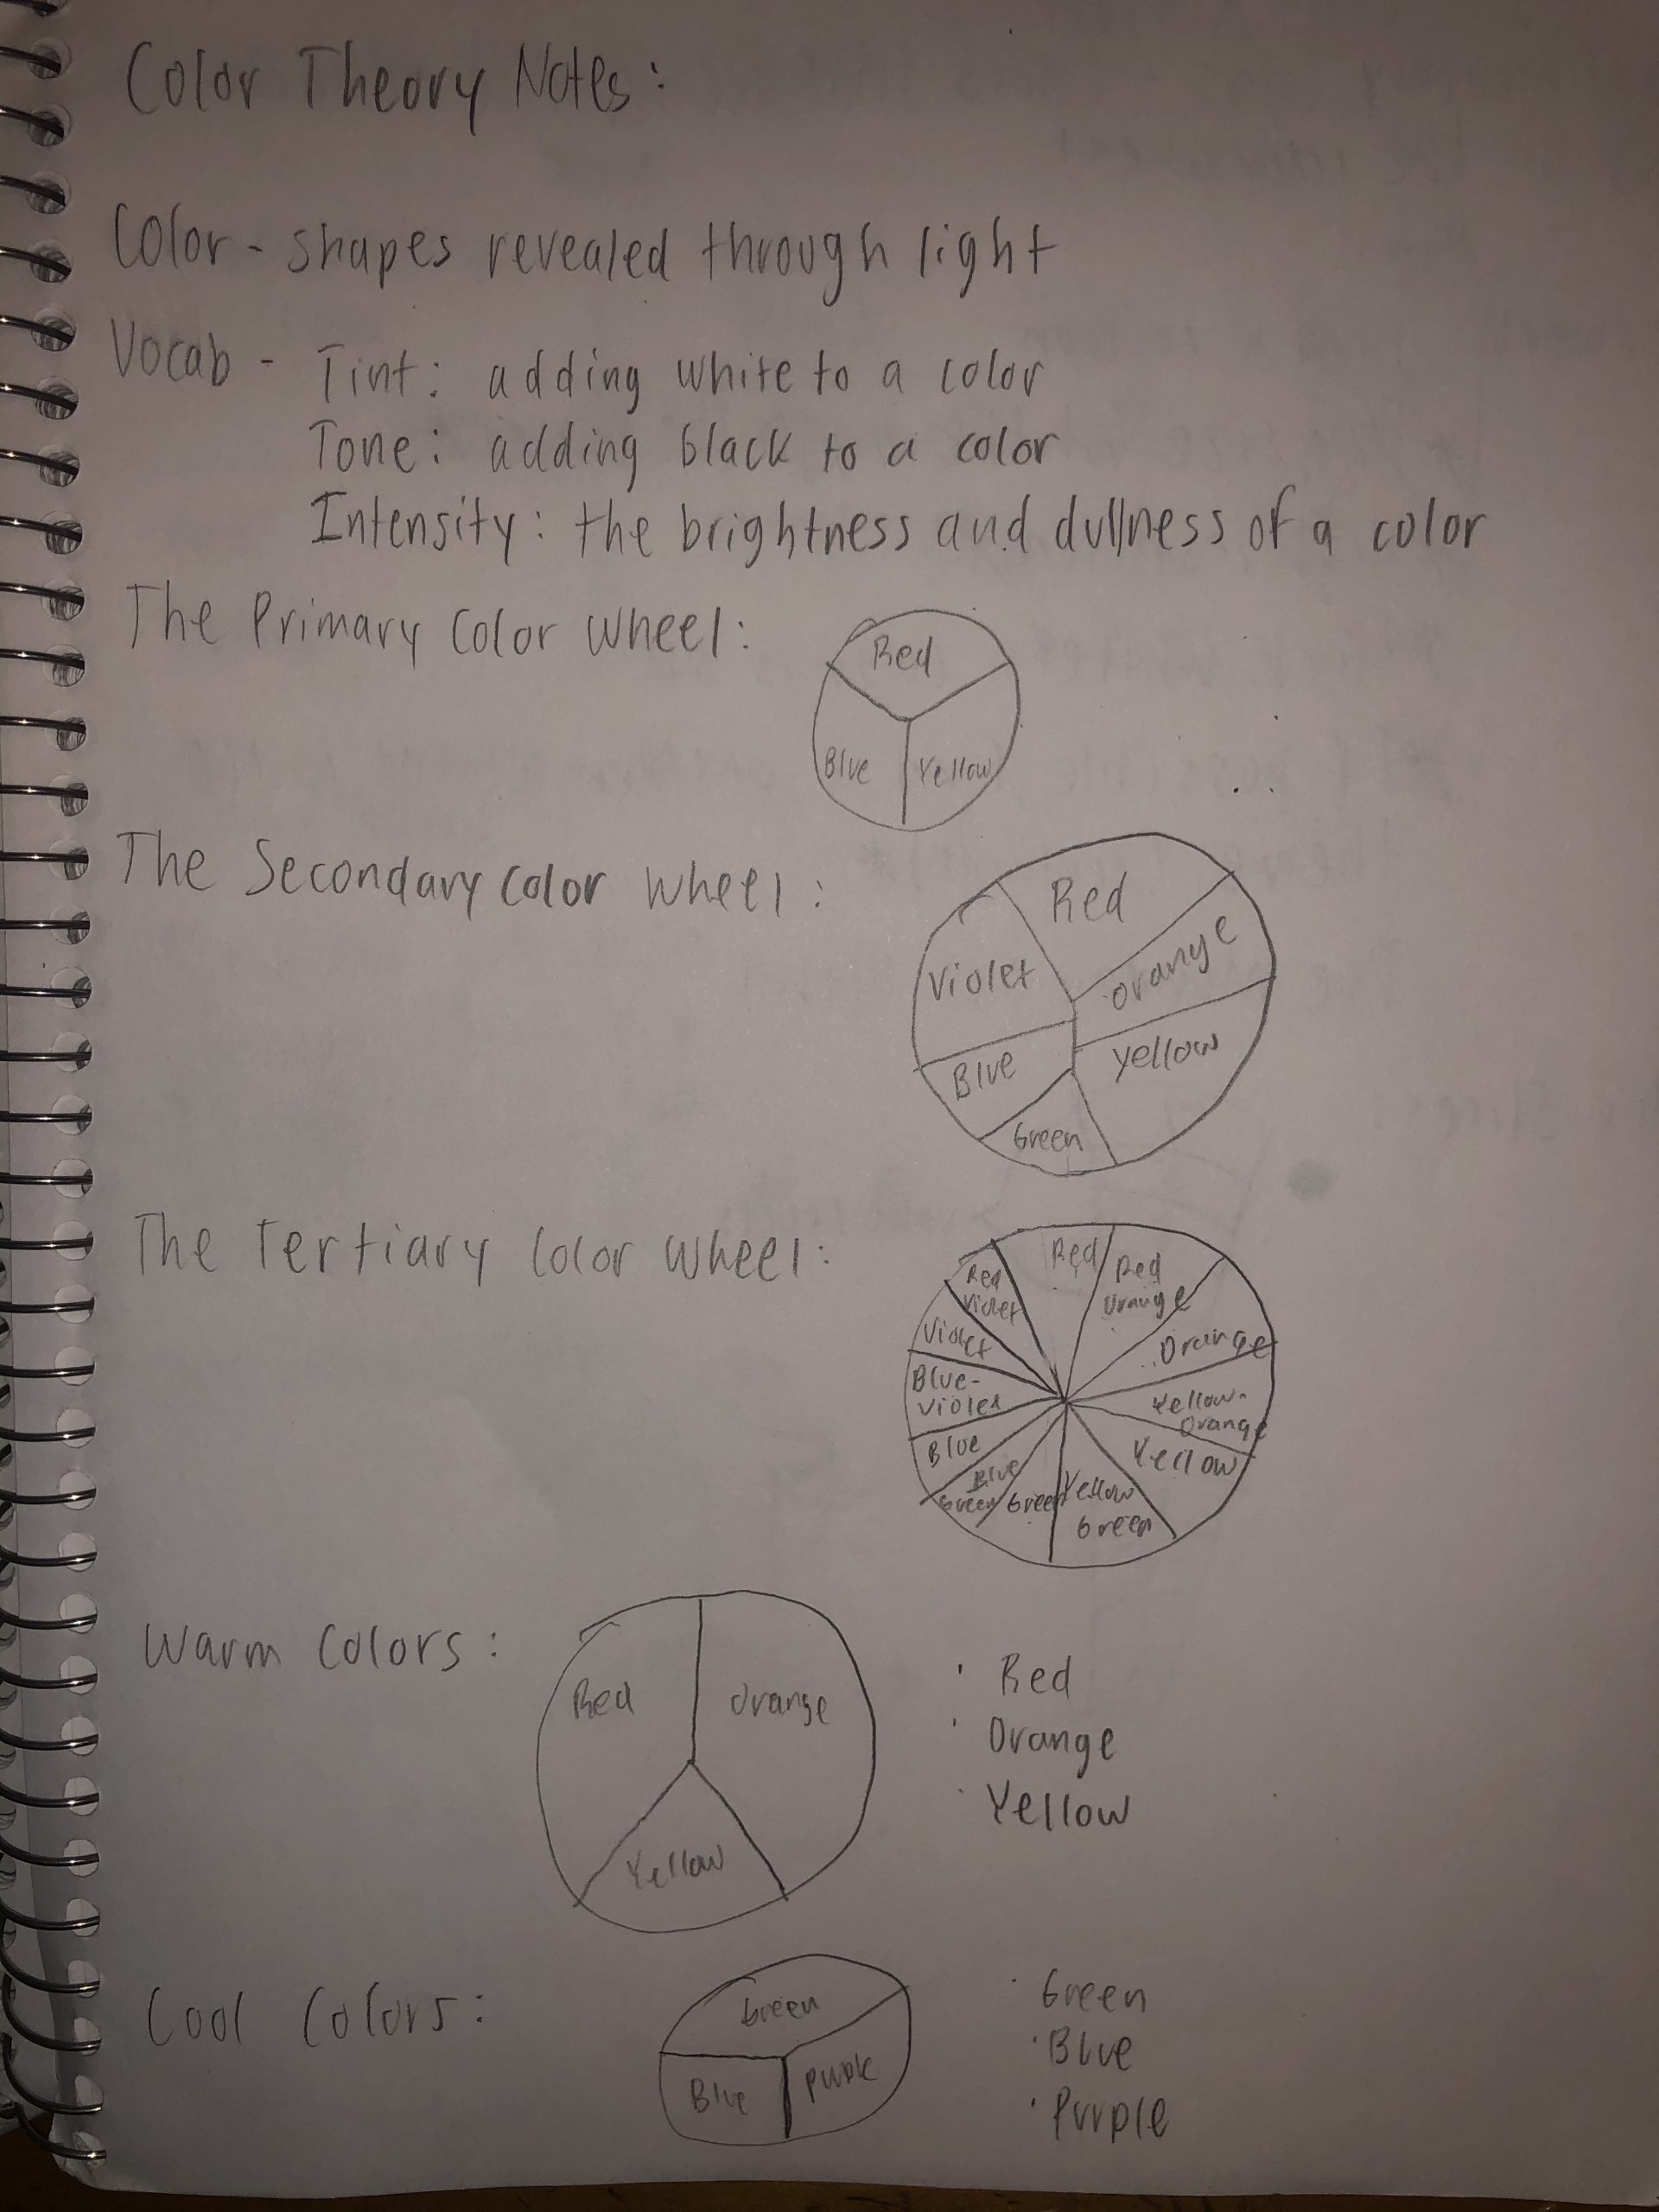
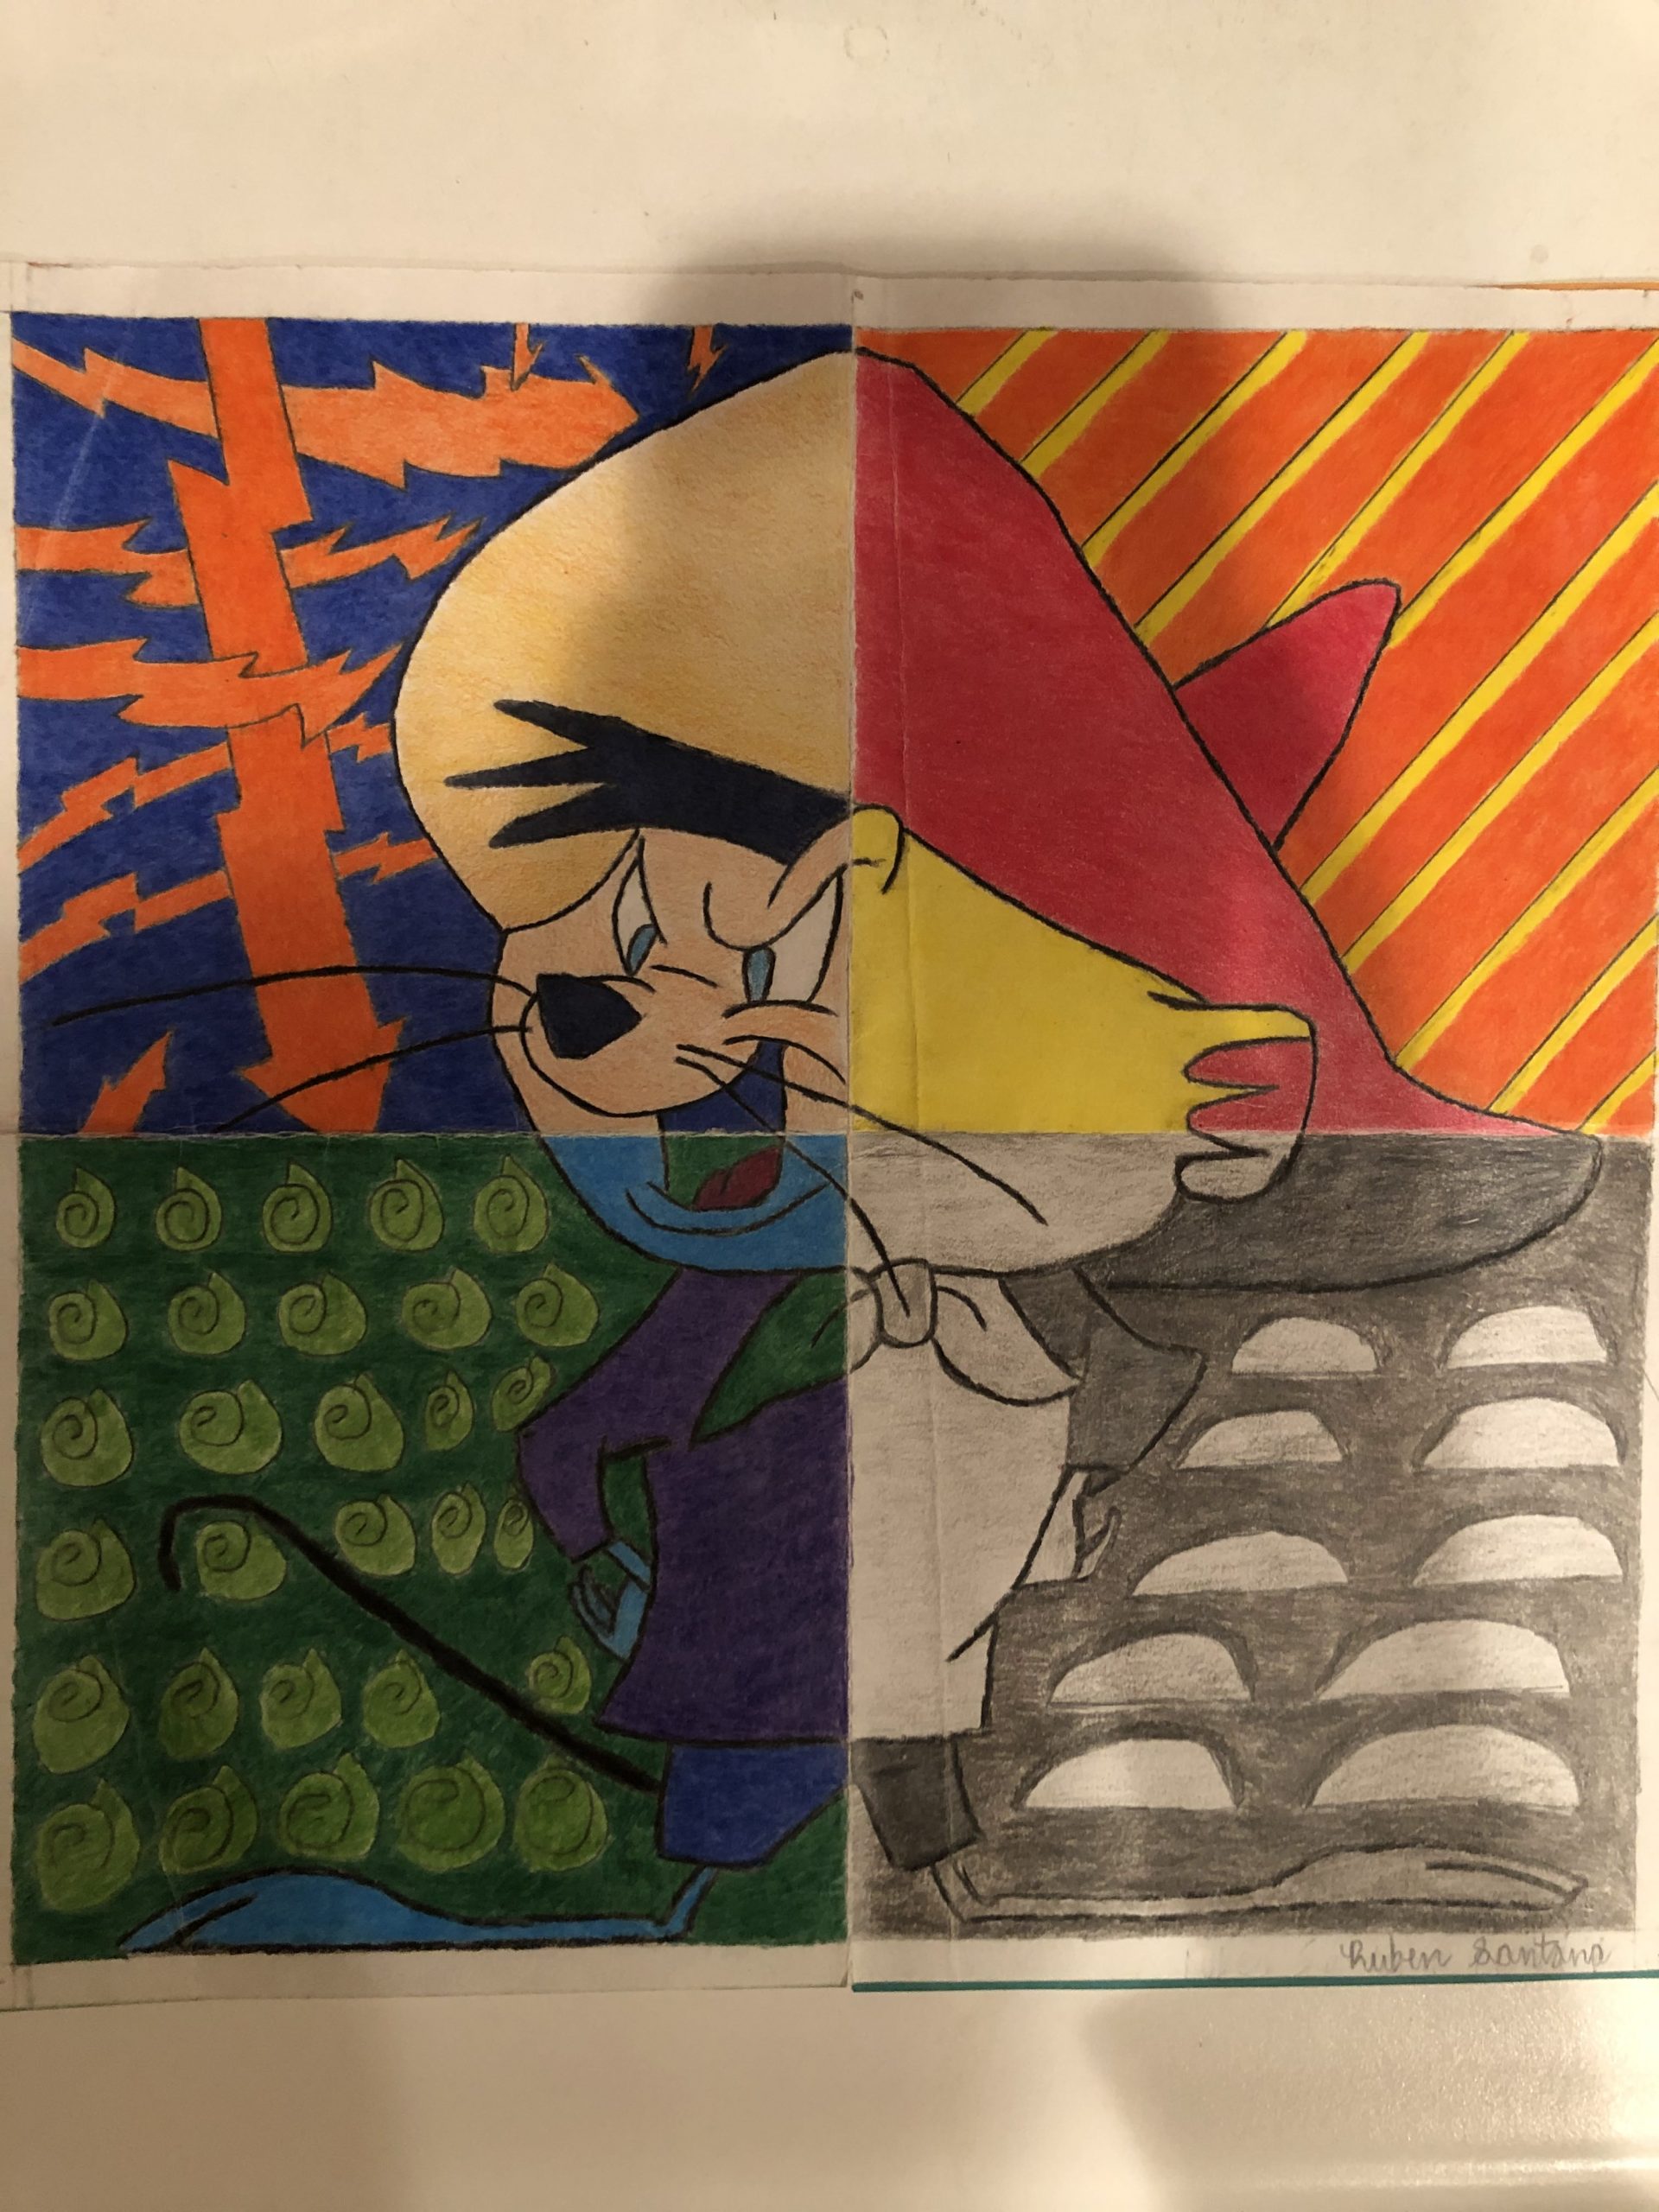
Nevertheless, I switched my original plan to a backup sketch that I had illustrated in my sketchbook. I wrote down a memory I had experienced with my high school art teacher in which he taught me these attractive repetitive patterns called zentangles. Zentangles are abstract user generated patterns that form a structure and give this impression of a decorative mosaic typically customized in glass material found all over the world. I had remembered he told me patterns like sea shells and diagonal lines (straws) were common starting points. From then on, I practiced different versions in my sketchbook of what my intended output was going to look like. The two reoccurring symbols that I felt expressing was the first letter of my first name along with a portrait of me. However, I chose to stick with representing myself via a cartoon character. Cartoon characters are sometimes portrayed radically different and similar oftentimes to the realistic counterparts of human beings. I carefully examined an animal and the animal that I felt strongly resemblance/relatability to was Speedy Gonzales, who is apart of the Looney Tunes universe. Looney Tunes was something I watched on television a lot during my childhood years, which helped me fuel the selective process in choosing someone from that realm. I learned through research that Speedy is personified as the fastest mouse in all of Mexico and speaks Spanish. I speak some Spanish and the way Speedy runs in the cartoons mirrors my work ethic in producing quality, efficient artistic pieces in a quick, timely manner. Afterwards, I started analyzing color theory and dimension size to figure out what colors I wanted to experiment with as well as how big I wanted this physical creation to be. Due to this brainstorming, I needed to find potential materials that would be reasonable, simplified, and practical. I ended up utilizing paper pad bought from the arts and crafts store: Michaels tied to colored pencils/construction paper/index cards/scissors/tape/ruler all located in my house. Glancing at the unit system of mathematics, I measured white construction paper in one fourth inches to compose a four quadrant square appearance. Then, I printed out a body reference of Speedy Gonzales off the Internet and began free drawing him onto the center of the composition. When I finished that aspect, I drew the zentangles that were associated with not only him, but myself as well. Two of the zentagles were sea shells and diagonal lines (just used these two because these are the two most common ones that people draw/design), but the last two were lightning bolts and tacos (incorporated these ones because I love agility and versatility and tacos are my favorite food). I played with complimentary colors, analogous colors, monochromatic colors, warm colors, and cool colors. As far as the data statistic, I have always been interested in world population in urban versus rural areas. I tried my best in finding a relevant and recent pie chart that would be a vital cornerstone to my drawing. On the back of the composition layout, I glued paper pad with their respective colors based off the zentangle colors I chose. One of my favorite personal cultural influences intermixed with my favorite art historical references I found relatively easy to compare my final project drawing to was pop art that occurred in 1950s America. The pinnacle figure who transcended not just that era, but also modern day and the future was Andy Warhol. Warhol created different vivid colorful renditions of the famous actress in world cinema history known as Marilyn Monroe. He painted and silk printed a head only point of view of her. I studied the series of Marilyn Monroes Warhol spawned through silk printing. Conclusively, I wrote down the percentage numbers from the pie chart I found to give clarity to the pressing issue of globalization.
Bibliography:
Cox, Wendell. “Demographia World Urban Areas: 2019: Population, Land Area & Urban Densities.” Newgeography.Com, Published 11 April 2019, www.newgeography.com/content/006272-demographia-world-urban-areas-2019-population-land-area-urban-densities. Accessed 03 Dec. 2019.
Wikipedia Contributors. “Speedy Gonzales.” Wikipedia, Wikimedia Foundation, Published 22 Nov. 2019, en.wikipedia.org/wiki/Speedy_Gonzales. Accessed 03 Dec. 2019.
Warhol, Andy. “Marilyn Monroe.” The Museum of Modern Art, MoMA, Published 2015, www.moma.org/collection/works/61240. Accessed 03 Dec. 2019.
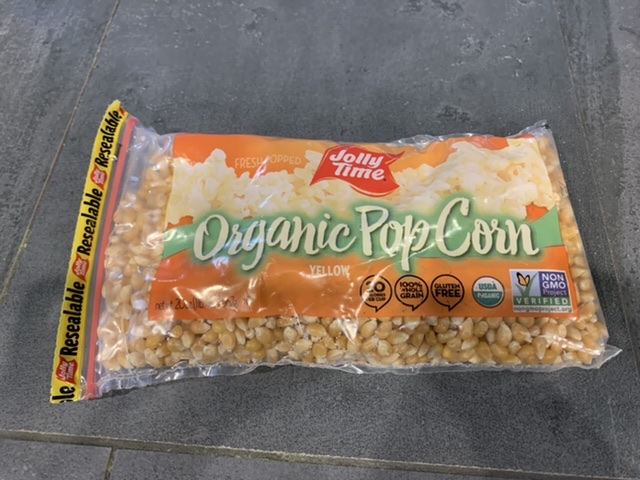
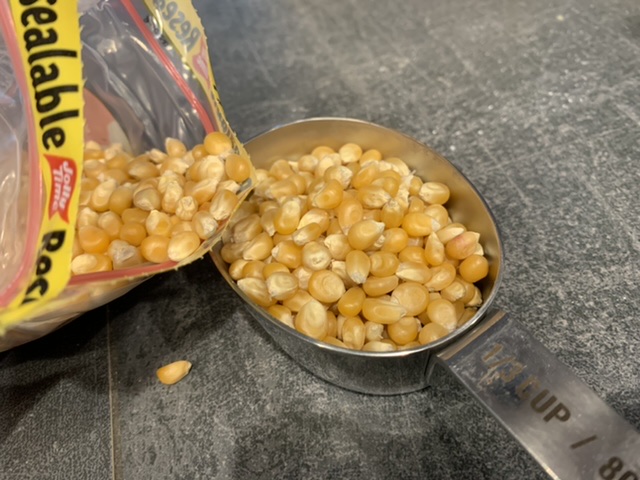
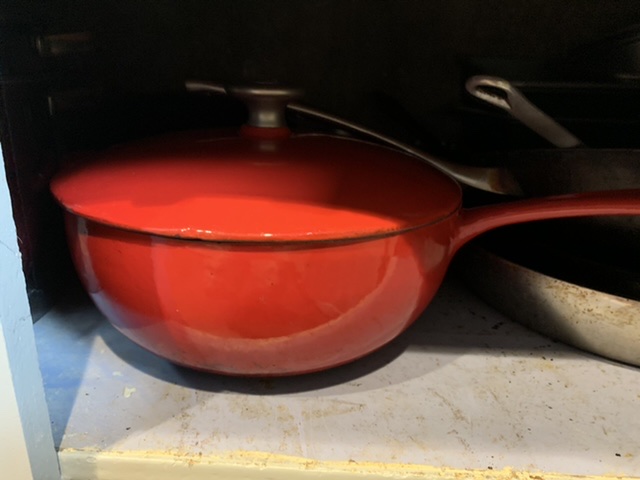
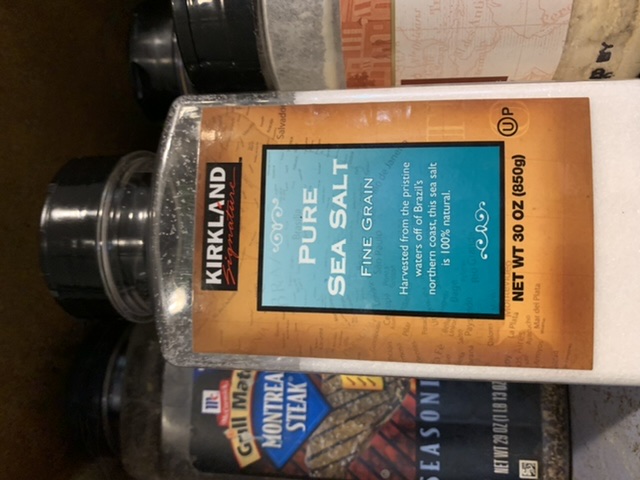
As my final project I did a recording of how I made popcorn. using popcorn it represented the sources of light intake I used in day. I used 1/3 a cup to represent the hours of light I used in one whole day. on an average even when I am going to work and school I used about 6-8 hours of light intake and I measured it out to how much it would be considered. One whole cup as a week 1/2 as half a week and 1/3 for a day. Using the popcorn it also has a break in between while we wait for it to actually pop and it gives a evidence in how energy I am using because it shows in the video as long as I am recording I am in the kitchen using light. My goal to show is how much light intake I use and how I should change that in my daily life style. By turning lights off more often and not using as much energy we can save the planet more and save more energy
Aprox 5 table spoon popcorn equals 1/3 of a cup.
I said in one day I use about 5 hours of light so there for I used the 1/3 of the cup.
An average house hold uses 28.9 kilowatts of energy 3.6 megajoles is equal to 1kwh hour so taking 28.9 converted to hours equals 8.027 mj hours so an average house hold a day used about 8 hours of light not including natural light so if we did 8.027×7 it gives us 56.19 mj hours or 202.2 kWh of electricity/energy of light used in a week again not including natural light. Using the same methods 8.027 x 30 would give us aprox 240 mj hour or 867kwh
5hrsX3.6mj hour =18 kWh in a day I use
18kwh x 7= 126kwh In a week / 3.6mj hour = 35 mj hours in a week
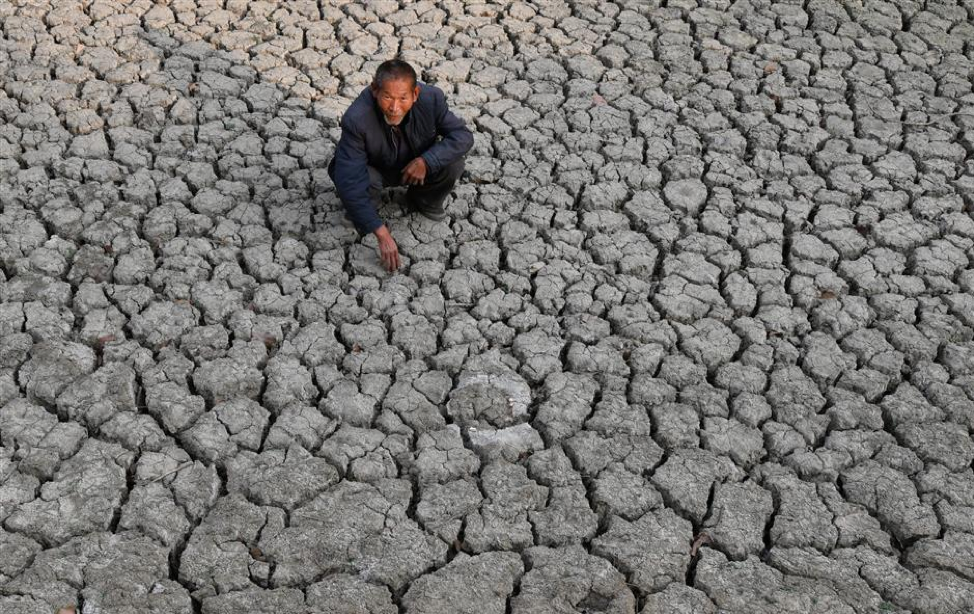
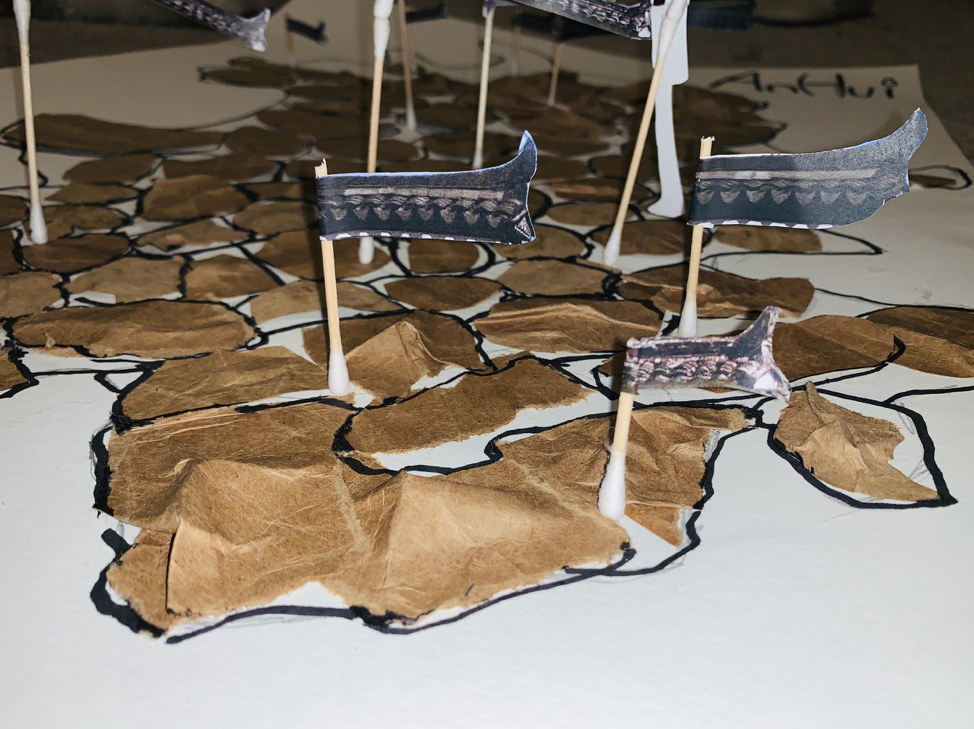
I first came up with the subject of drought because my hometown was suffering from drought. In my memory, Anhui had nothing to do with drought, but I was shocked when my parents told me that many famous rivers were drying up. I had mixed feelings as I searched for more information, photos and data on the drought. So I decided to continue with this theme. At the same time, I want to add some Chinese elements or elements about my hometown. Hui-style architecture is a representative of ancient Chinese architecture. Using the eaves as a representation of the graphic makes my representation more diverse.
Research
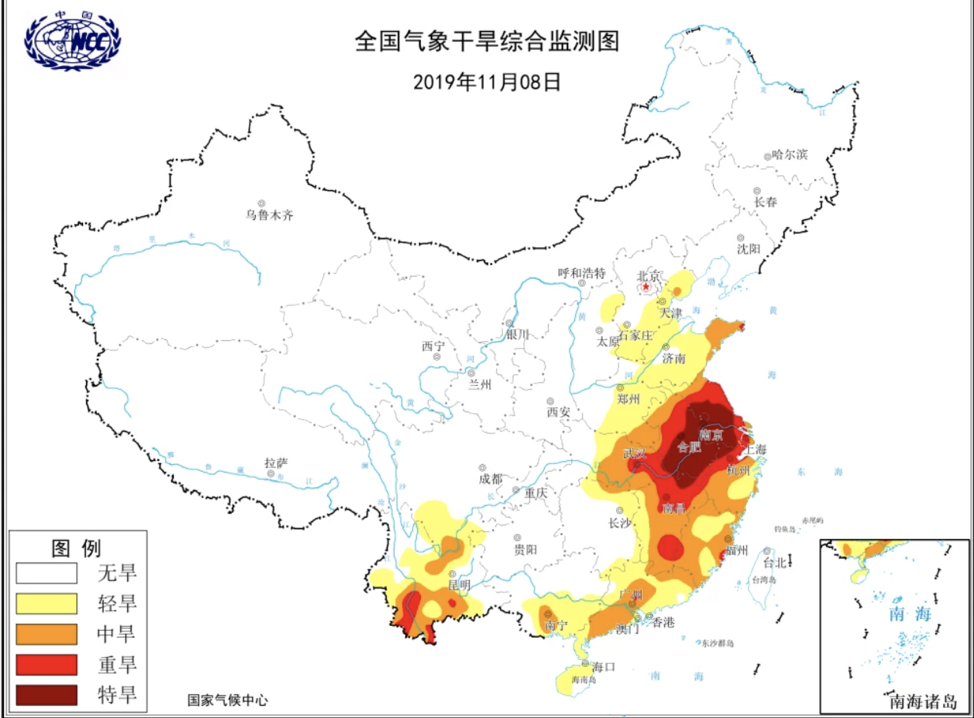
As of
Monday, a total of 412,700 hectares of crops were affected by the lingering
drought, causing direct economic losses of 1.61 billion yuan (about $227.5 million),
it said.
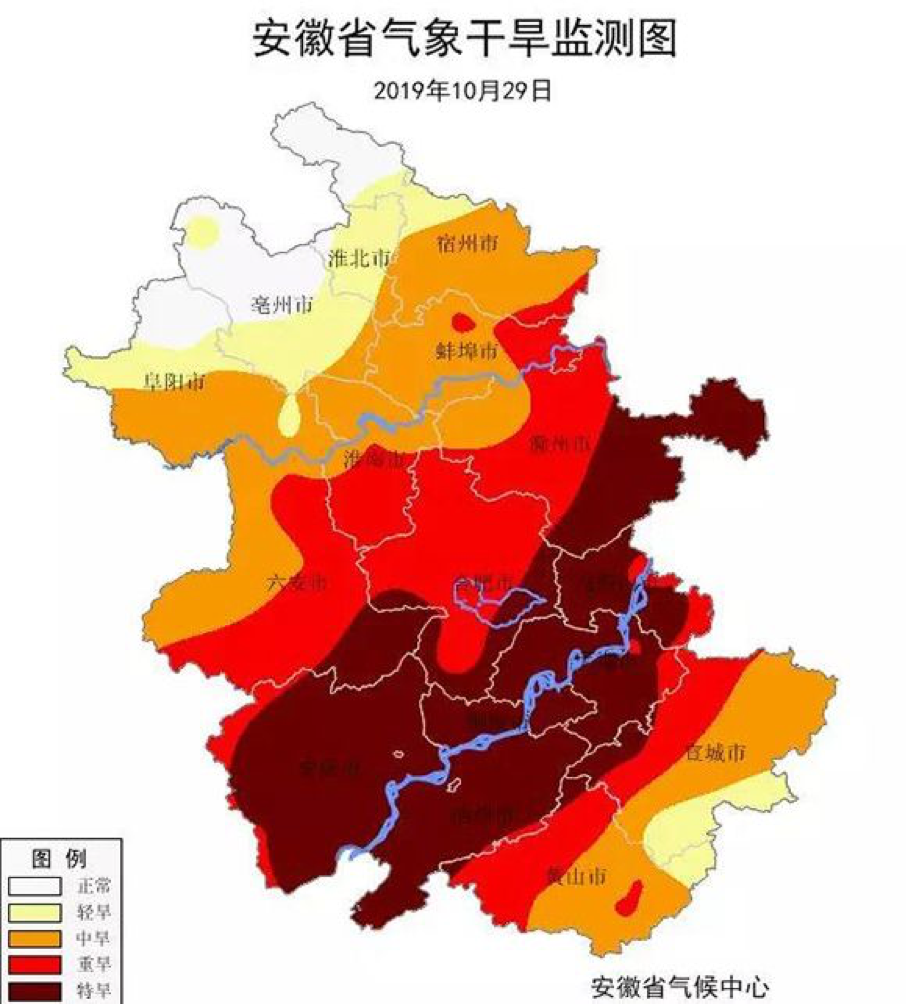
From August 12 to October 28, the average rainfall in the province was
60 percent less than normal. That was the second-lowest level since 1961, the
provincial meteorological department said.
“The forest is so dry that it takes only one cigarette butt on the ground and 30 seconds for it to burst into flames,”
I found some graphs about the drought in Anhui. Even drought in China.
2. Development
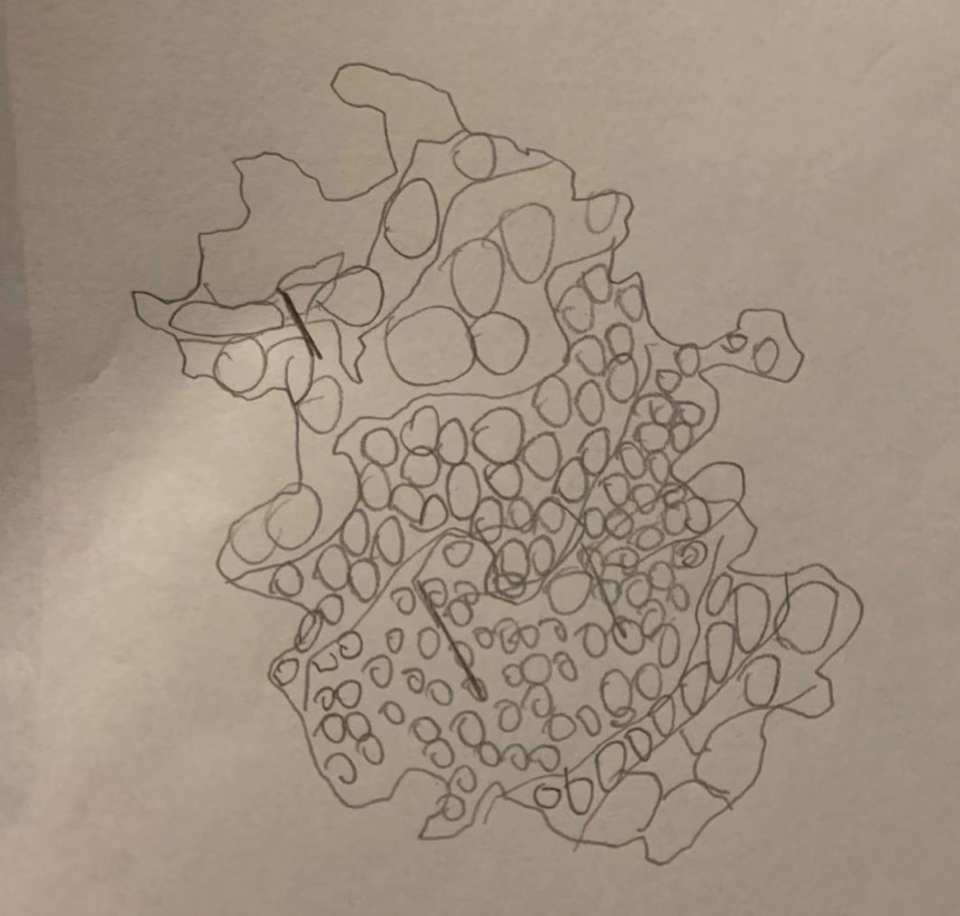
I want to show the drought in the picture, and because of the color, I immediately thought of the carton. I took it apart and cut it into pieces. The drier the land is, the more it’s cracked and the less patchy it is. Use a black marker to show signs of cracking and to show how dry the land is. To create a more multidimensional feeling, I combine cotton swabs with the cut eaves of the Hui-style building to make flags. The longer the cotton swabs, the longer the eaves, the more obvious the drought
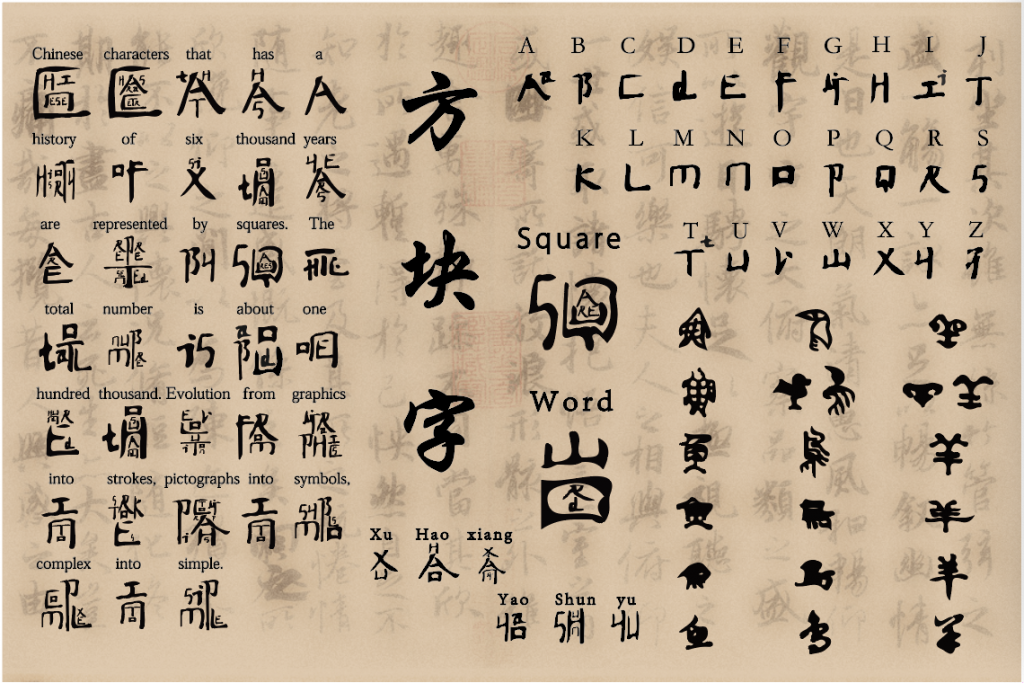
At the beginning of the project, when I was talking with Haoxiang Xu about his ideas, I thought of Bing Xu, an artist I had known. Bing Xu is a famous Chinese artist whose works combining Chinese characters with English have attracted people’s attention.
Bing Xu’s words inspired us. We thought it would be interesting to combine data with traditional Chinese culture, so we worked together on this project.
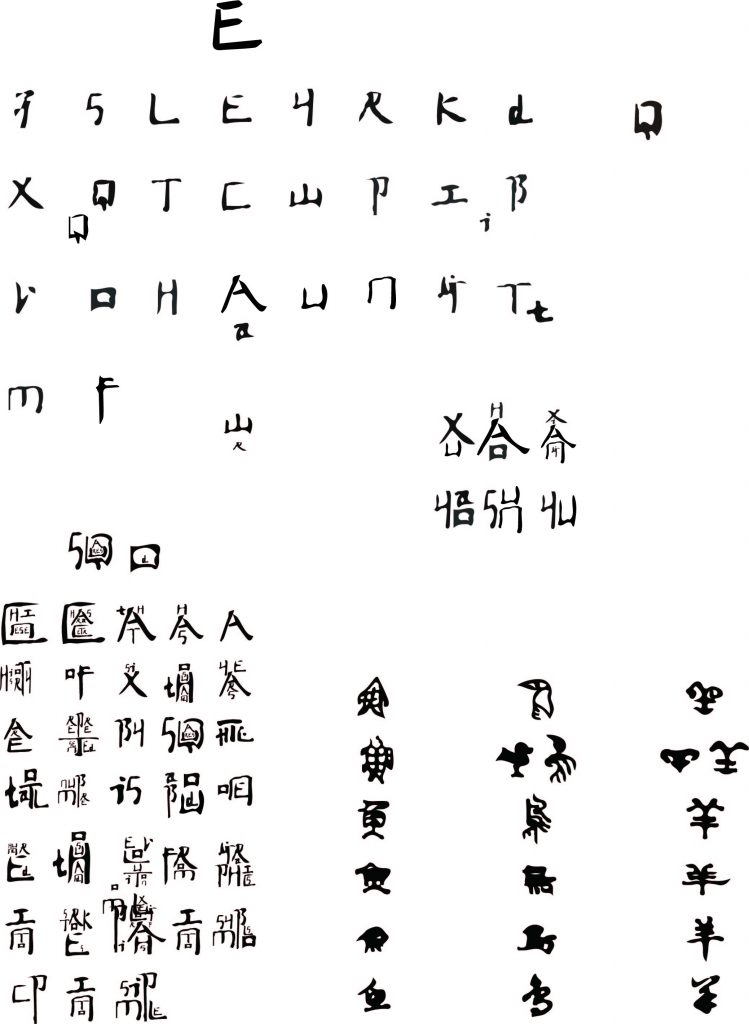
We first identified the expressions we wanted to express and introduced the relevant data of Chinese characters. Then the letters of each word are combined to meet the basic requirements of the block.
In addition, the conversion of each letter to a part of the overall text is necessary.
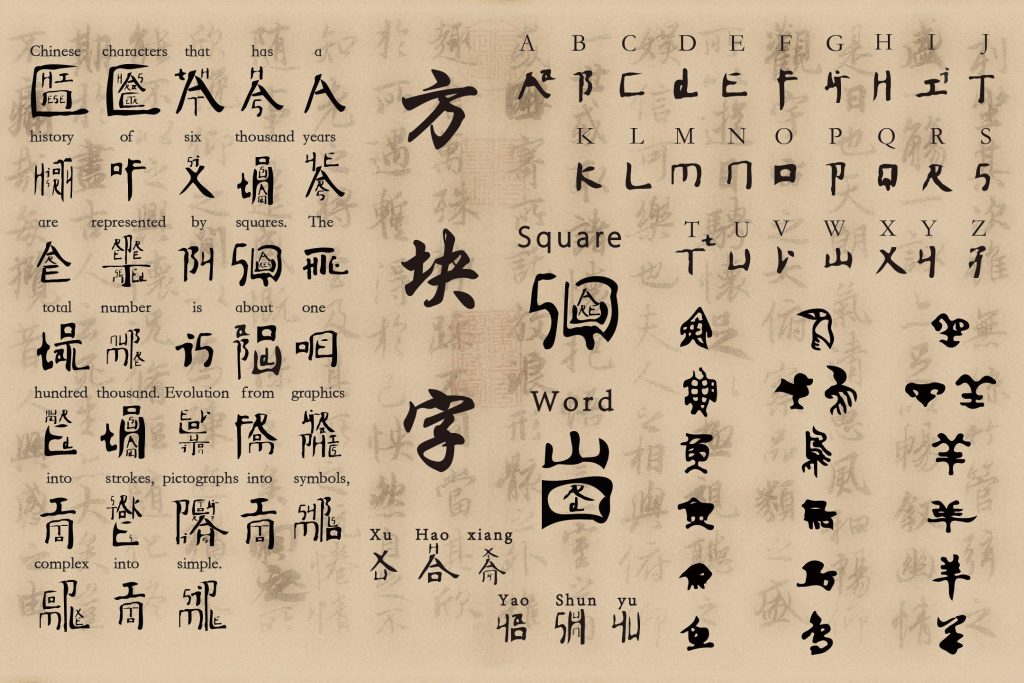
We achieve the effect of block letters by combining letters. Throughout the poster, we put the body of our design on the left side of the whole, while on the right side are the corresponding radicals of each letter and the continuous evolution of the block.
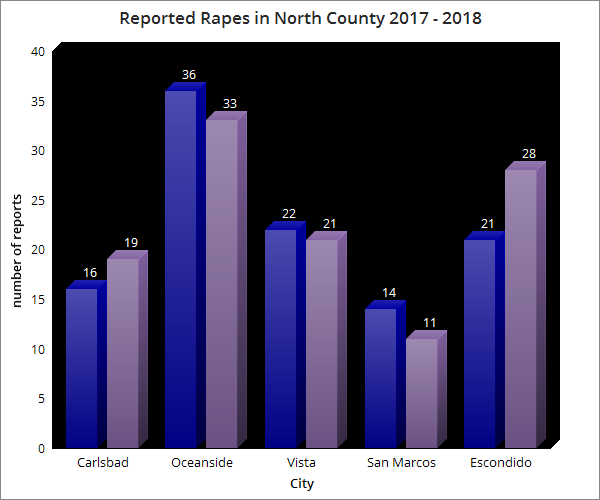
Going into this last project I wasn’t sure what direction I wanted to go in. Over the course of the semester two topics I showed interest in were bringing awareness of the decline in the honey bee population and the second was bringing awareness to the number of individuals who are victims of sexual assault. My first idea was to try to combine the two somehow, but I felt it wouldn’t make sense and it would be very hard to correlate bees and sexual assault. I immediately thought about the play on the word ‘Bee’ and how you can use that in a way to remind people, both victim and learner, that our voice is the tool on putting an end by educating and not silencing the victim. I decided to come up with a design where people can get a visual of how many people have been effected in there area, like actual people. However, I still wanted to protect the identity and also not represent the victim as a helpless victim. One artist that I had in mind is Alfredo Jaar, a known east coast photographer who worked a lot with photo journalism. Alfredo did a project on the “Rwandan Genocide” and while doing the project although his main goal was to try to connect the viewer to the reality of whats really going on in the world through an image but still being mindful of the victim and not re-victimizing them. Alfredo used the eyes of the people he photographed and cropped the rest of the picture out. I decided to use the mouth of everyday people, young, old, boy, girl, black, white, and more because this is an issue that does not just affect women, or a certain age or race, and I think thats a stigma that people misinterpret about issue when having the conversation. On the poster there are 112 images of different individuals representing the number of reported rape cases in North county San Diego. I want the viewer to recognize the overwhelming realization that there are a lot of voices to hear and I also put the number of crimes that go unreported which is 1200. So it is making the connection that there is a lot but still a lot more who are unheard due to not being protected, believed, or judged. I am satisfied with the design of the poster and I hope it broadens the perspective and also makes people compassionate enough to want to learn more on how they can help stop this issue.
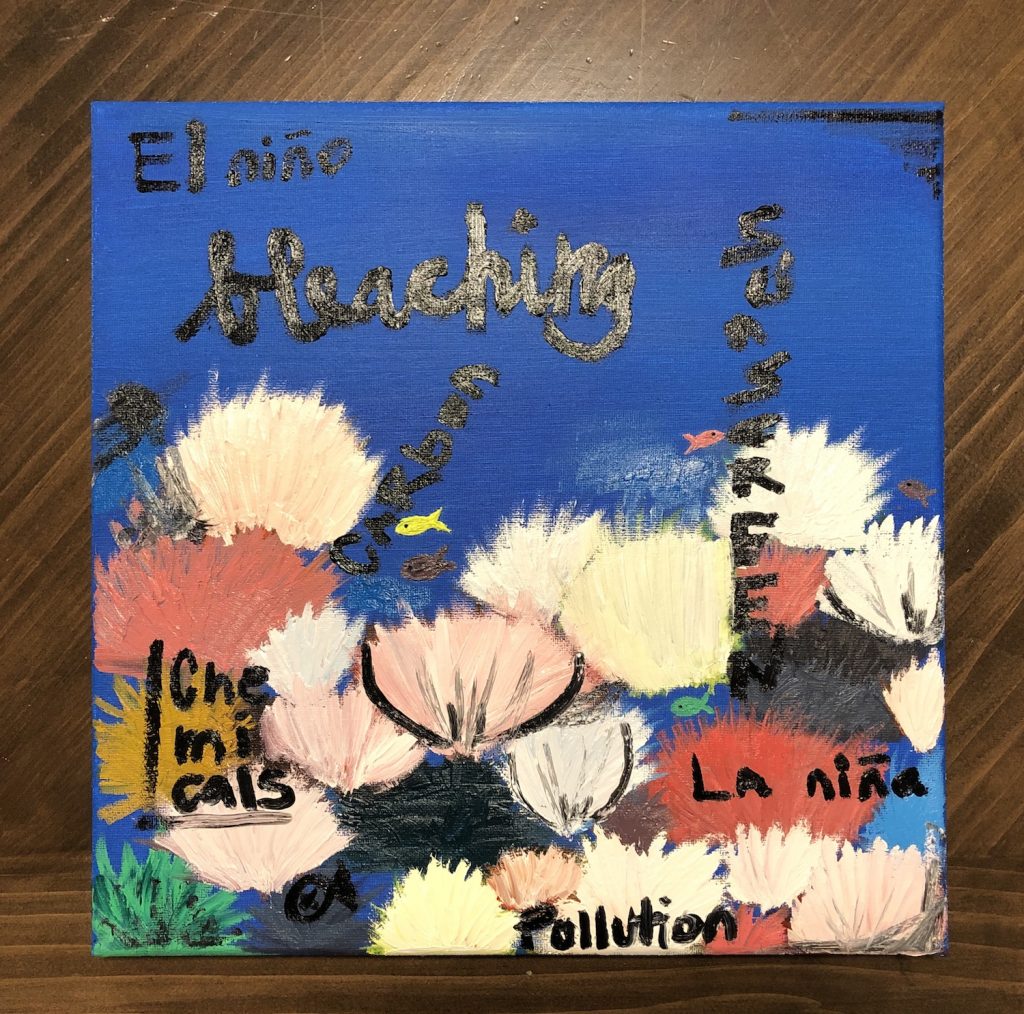
For the final project I got interested in coral bleaching. I visited Hawaii over the summer, and one of the days we went to Hanauma Bay Nature Preserve. Before we could even go down to the beach in the bay, we had to go through this video class about the ways we have to keep the coral reef safe. They even handed out to all of us special sunscreen that wouldn’t harm the reef, which did not contain Oxybenzone. There are many other chemicals that are harmful to the reefs, but this is one of the main ones that is found in over 3500 sunscreen products across the world. I knew before researching that sunscreen was bad for the reefs but I learned about the other causes as well. There are natural heating and cooling weather patterns called El Nino and La Nina, that cycle every several years. With global warming and greenhouse gases increasing, these cycles are happening more rapidly, and it is the heating cycles that cause a lot of coral bleaching.
Coral bleaching is when coral gets stressed from heat or pollution it releases an algae called zooxanthellae, which lives in the coral’s tissues and gives it the beautiful colors. This process of releasing algae depletes the coral of color, or bleaches it, as well as increases the chances of its mortality. The zooxanthellae algae is vital because it “provides the corals with an easy food supply thanks to photosynthesis, which gives the corals energy, allowing them to grow and reproduce” (marine conservation.org).
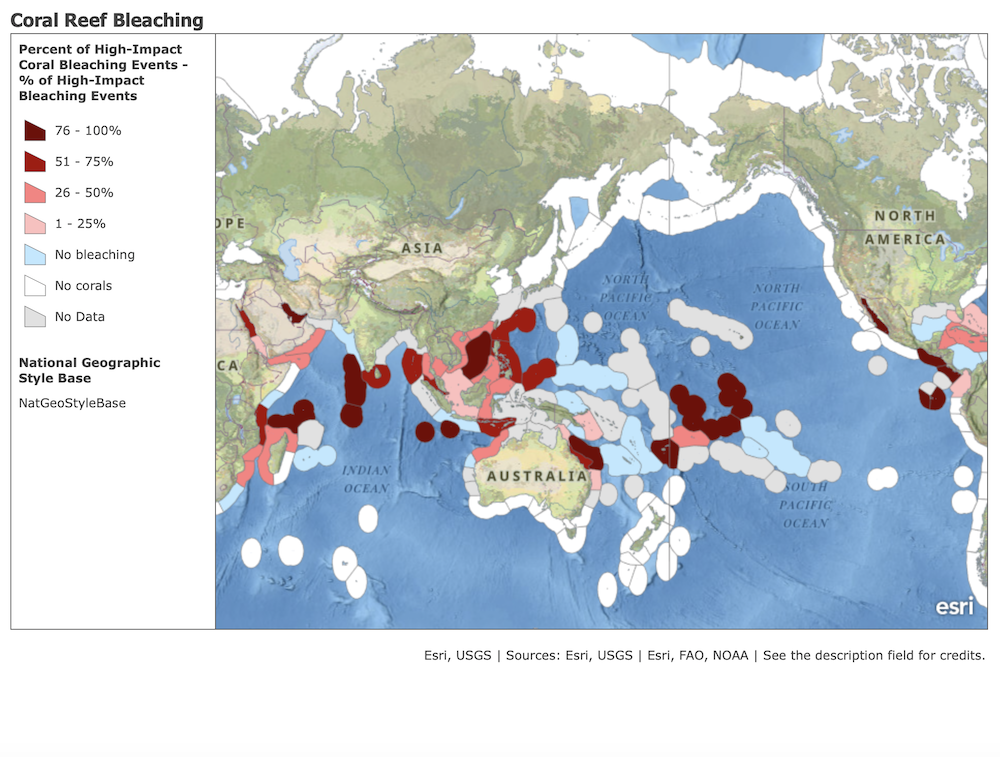
The are of sustainability I chose to look into falls into the marine life category. Living so close to the ocean, and having visited preserves like the one in Hawaii, it has caught my interest. I also remember very well when the last major bleaching event happened in 2016, when 93% of the coral had been bleached killing 22% of it. I based my data visualization of the information I found on a website called CarbonBrief.org, the articles name is “Severe coral reef bleaching now ‘five times more frequent’ than 40 years ago” written on January 4th, 2018.
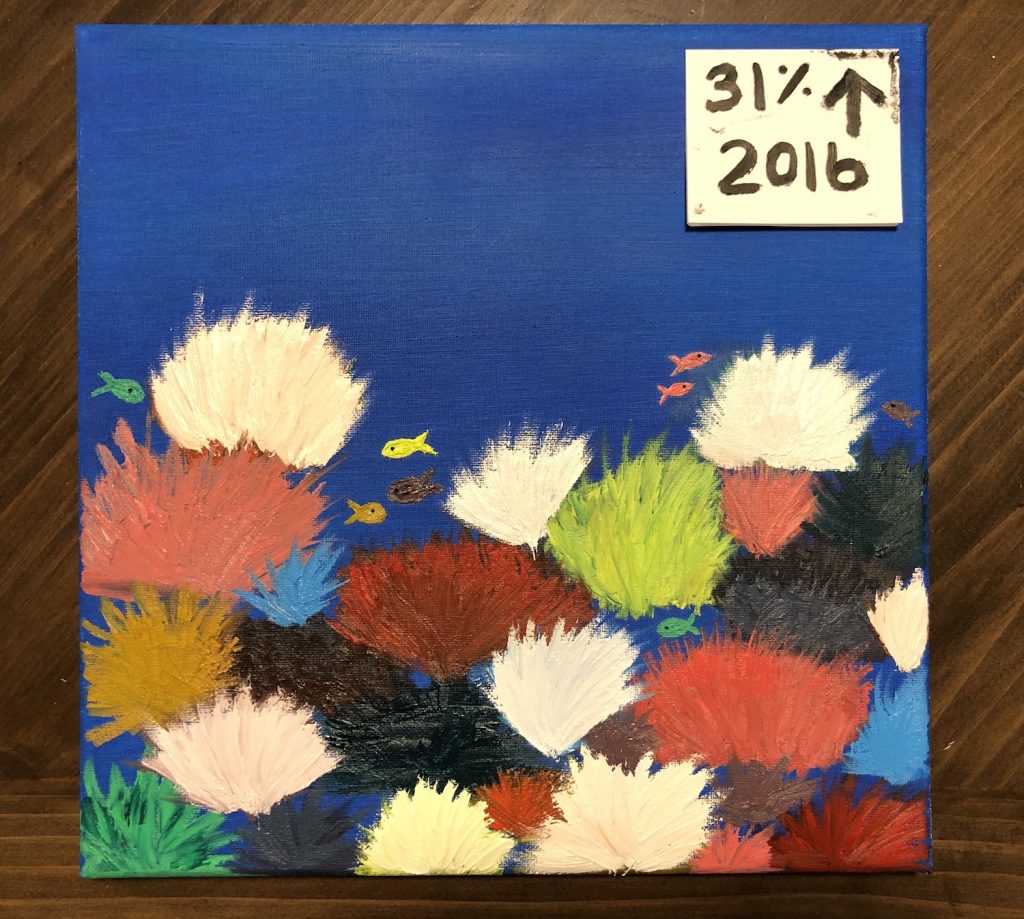
I knew that I wanted to paint a coral reef landscape and build off from there. So I started with the reef and then I got stumped because I really didn’t want to ruin the painting. It was really pretty and actually the first time I had painted with oil paint before. I knew I wanted to kind of follow the work of Jean-Michel Basquiat because I have been obsessing with his work since I learned about him in my Contemporary Artists class this semester. So I had a bunch of his work pulled up on my laptop for brainstorming. Then I also knew that I wanted to use this group of bar graphs that I had found from the CarbonBrief.org website. I had all of these separate goals but was having a hard time trying to put them all together. After meeting with Professor Lucy Soloman and brainstorming, we figured I would definitely have to ruin the painting.
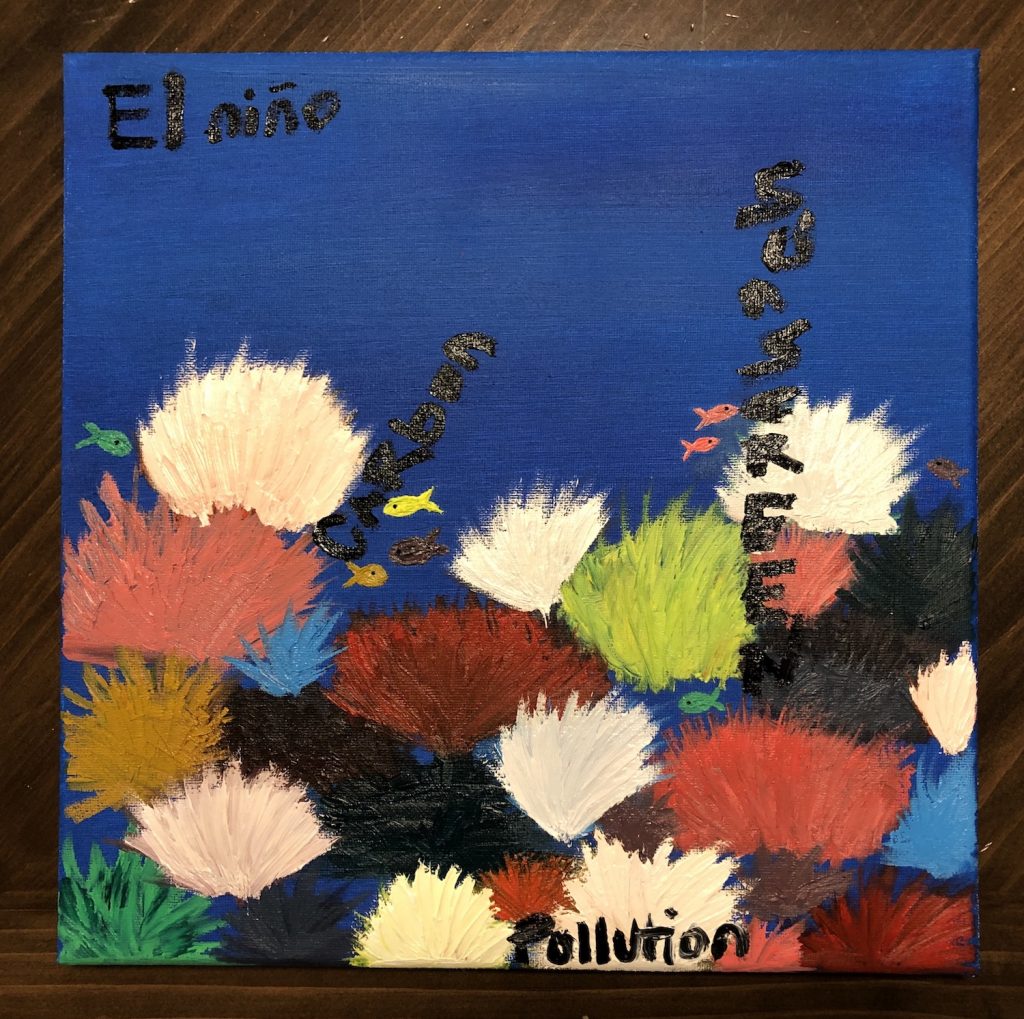
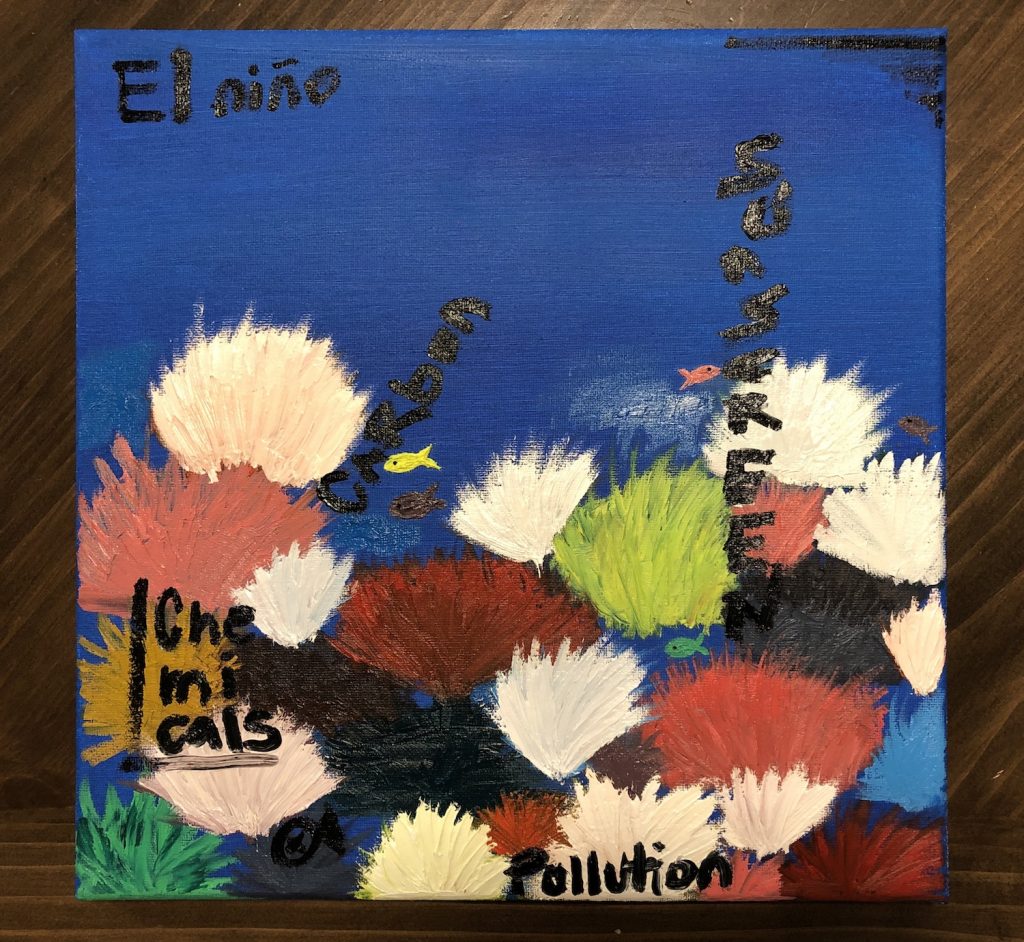
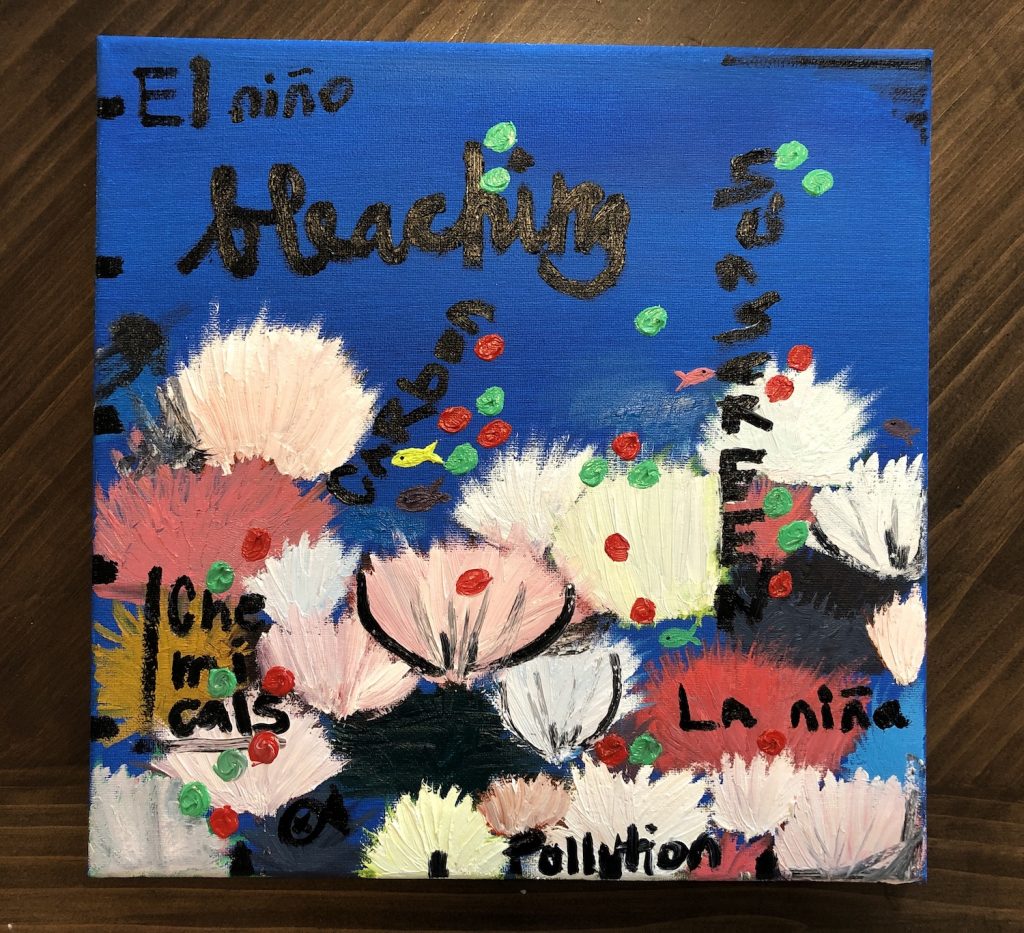
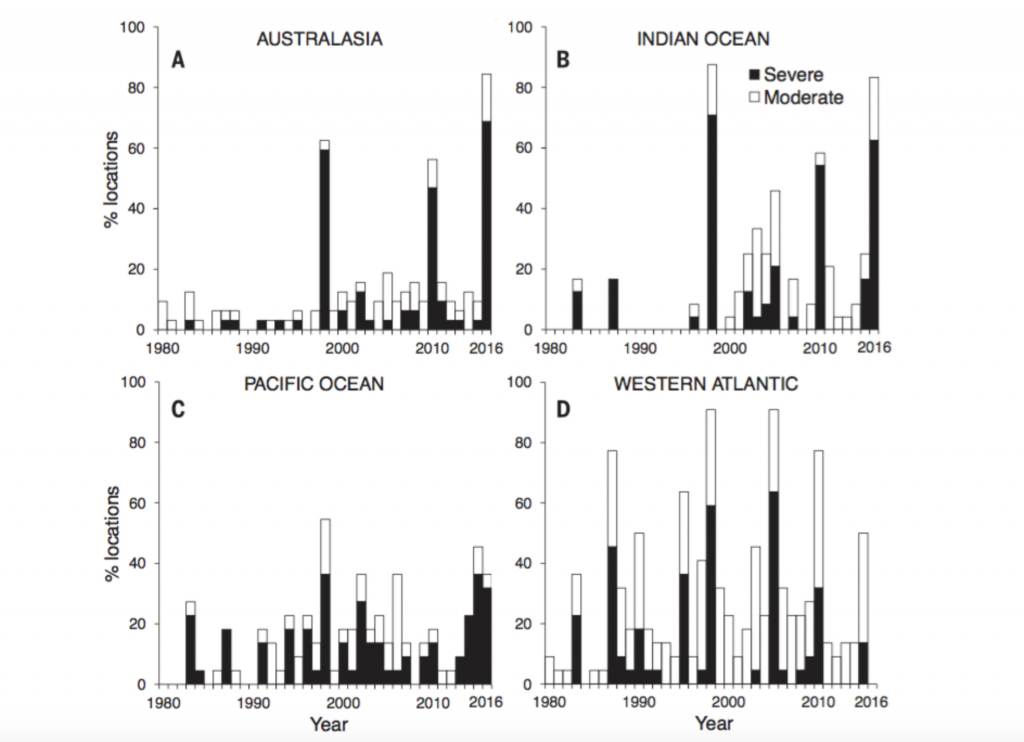
My coral reef had 28 corals painted, so with the two statistics that I had found that I want to represent I figured the math of 8% of 28 being 2, and 31% of 28 being 8. The 8% represents the rate of coral bleaching happening up to the 1980’s so I painted white over 2 corals; the the 31% being the new rate starting in 2016, so I painted 6 more corals to total to 8. I photographed each of those with each layer. From there I was stumped a little bit, so I went back to my Basquiat inspiration and just started defacing my reef with writing words that cause coral bleaching, along with some random markings and painting over some of the fishes. The marine life is affected tremendously by the coral bleaching so I thought that was a cool subtle way to throw that in there. With each new layer of words I painted, I also painted more corals white, and photographed its progression. Finally when I wrote out all the causes of coral bleaching, I still had my graphs to represent. That is when I came up with the idea to plot to points of the major years 1983, 1998, 2010, 2016 of moderate and severe bleaching event occurrences over a span of Australia, the Indian Ocean, the Pacific Ocean, and Western Atlantic. The green plots are the moderate events, and the red is severe.
Below is that Youtube link to the stop motion video of the progression of the my visualization:
Lindsey, Rebecca, and Michon Scott. “Unprecedented 3 Years of Global Coral Bleaching, 2014–2017: NOAA Climate.gov.” Unprecedented 3 Years of Global Coral Bleaching, 2014–2017 | NOAA Climate.gov, 1 Aug. 2018, www.climate.gov/news-features/understanding-climate/unprecedented-3-years-global-coral-bleaching-2014%E2%80%932017.
“What Is Coral Bleaching and What Causes It – Fight For Our Reef.” Australian Marine Conservation Society, 2019, www.marineconservation.org.au/coral-bleaching/.
Lewis, Sophie, and Jennie Mallela. “It’s Official: 2016’s Great Barrier Reef Bleaching Was Unlike Anything That Went Before.” The Conversation, 21 Oct. 2019, theconversation.com/its-official-2016s-great-barrier-reef-bleaching-was-unlike-anything-that-went-before-88078.
Dunne, Daisy. “Severe Coral Reef Bleaching Now ‘Five Times More Frequent’ than 40 Years Ago.” Carbon Brief, 4 Jan. 2018, www.carbonbrief.org/severe-coral-reef-bleaching-now-five-times-more-frequent-than-40-years-ago.
“Libre Soy” (DACA) Recently Trump wanted to terminate DACA ( Deferred Action for Childhood Arrivals), therefore on November 12, 2019 he was going to speak to the Supreme Court to hear his arguments. Dreams are often time scared to speak, and so I want to be that voice for them. I have family members who are protected under DACA and it is giving them that opportunity. Most dreams do not speak Spanish and have never been to Mexico since leaving, so if they were to terminate DACA most would be deported without a place to stay and who knows what else. If you’re under DACA you need to renew every 2 years and have background checks and more, these dreamers just want a chance at work, school and most importantly the American dream. Trumps argument is that “Many of the people in DACA, no longer very young, are far from “angels”. Some are very tough, hardened criminals”. He is very wrong, if you apply for DACA you cannot be a criminal you go through a background check. There is lack of research on the president’s part because dreamers use this to work, drive, and gain an education for a bright future. There were rally’s and I saw posters with butterfly’s and the butterflies represent the crossing migration and how it is natural. We recently had a butterfly migration and it was beautiful, beautiful things have come out of the migration of some dreams. “Libre Soy” means I am free; the dreamers are free to explore the world without as much fear. Although they still do fear for their lives because of the Supreme court and Trump. The Data I decided to focus on is the identity of the dreamers and where they come from. The majority come from Mexico, then El Salvador, Guatemala, Honduras, and Peru. The average age of when they came to the U.S was 6 years old, and average current age is 25 years old. The top state in residency are California, Texas, Illinois, New York, and Florida. There are 89% dreamers who are currently employed; and 44% who were employed before DACA. I decided to use a butterfly for the migration and the beauty of the dreamers and Libre Soy to show that they just want to be free to gain education and work. I wanted to do wood cut again, but this time on a t shirt so I can make and sell in the future to donate money to places who help Dreamers who need help. This is a little different than my last project about the water usage because of the reason that I did not transfer the data onto the wood block and shirt, but I showed the data of the migration and the people who are just like anyone without DACA we are all human and deserve a chance at the American dream.
Refrences
Richter, Felix. “Infographic: Who Are America’s ‘Dreamers’?”
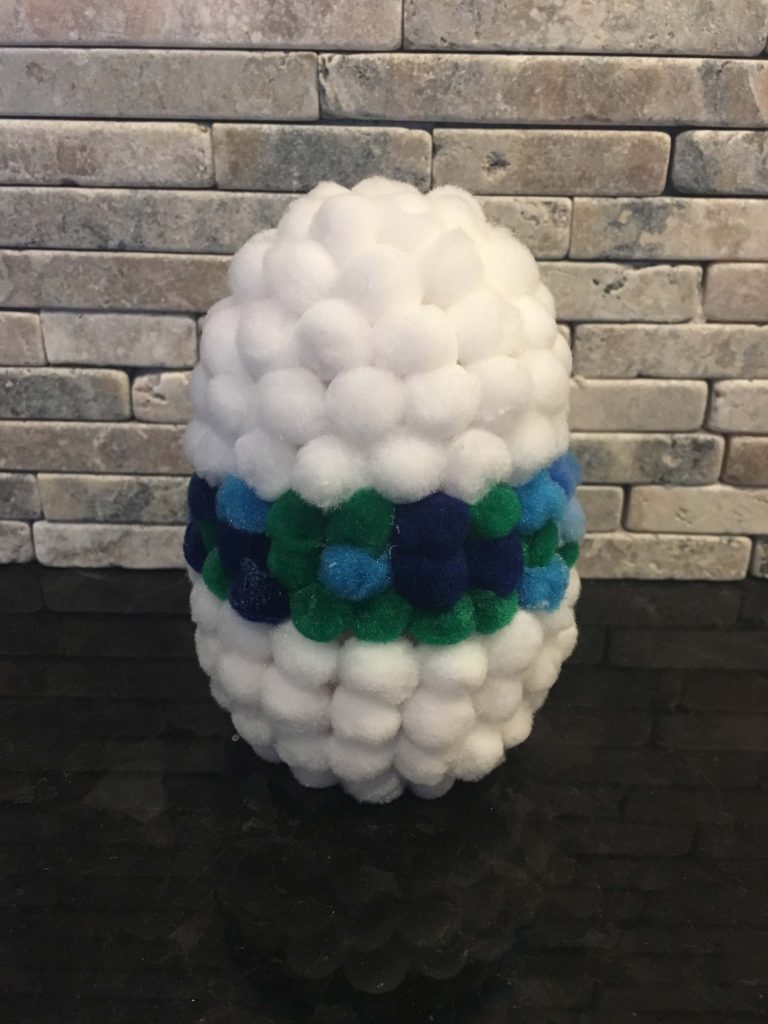
I remember hearing about the droughts occurring in California and the current rise of population happening in the world. It made me curious to visual the data myself and see what areas would be affected in California. I approached my project by researching and gathering information from the state of California about it’s population and water supply. I collected most of the data from the published book “The Atlas of California: Mapping the Challenge of a New Era” and used this to gather my information. It shifted my attention to not only about water necessities for citizens, but also the agriculture produce. It brought my attention to how nearly half of the water supply goes to agriculture or landscaping. As cities are growing rapidly it poses a challenge for farmers to meet demand. California has one of the biggest water infrastructures in the United States, but also pose environment issues with storage dams and aqueducts. These infrastructures are the current solution to the water demand mostly during the summer and in southern part of the state.
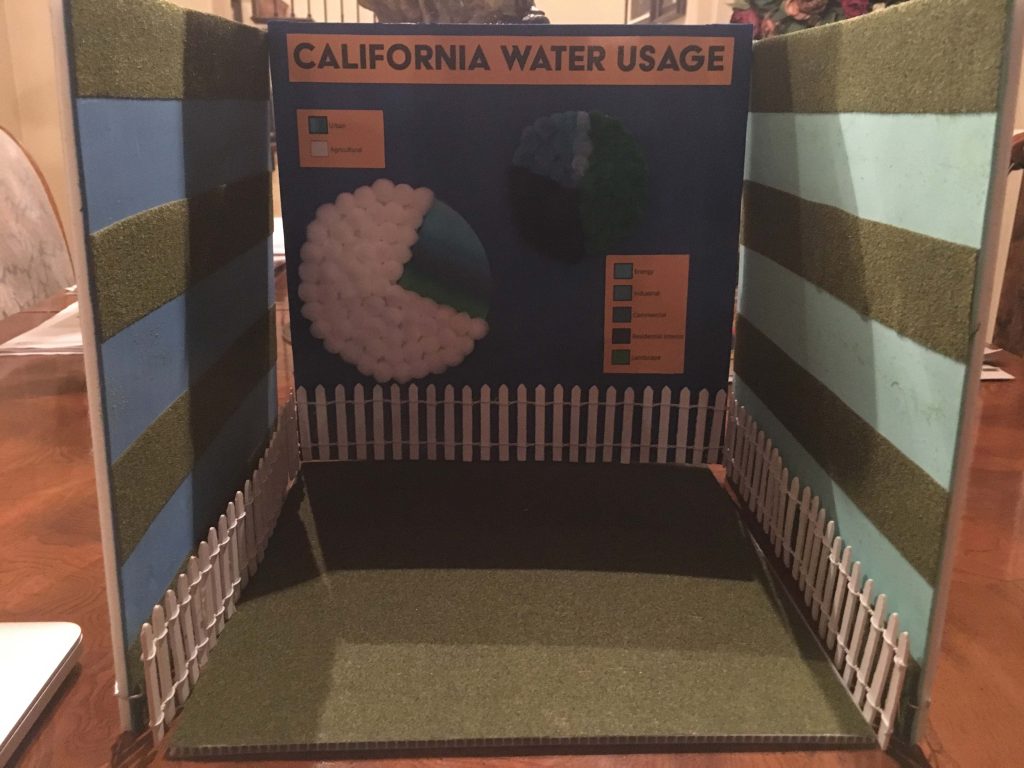
A created a data translation of California’s water usage made into a colorful cotton egg sculpture that became data that you could see and feel. I wanted to bring that project into the Data Stacks install being presented on campus for earth day. I then needed to create a space that will communicate the information of California’s water usage with the egg as the center piece.
I researched some various artist and movements I came across the Guerrilla Girls, which is an anonymous group of female artist devoted to fighting against sexism and racism within the art world. The way they used simplicity to convey information in an impactful way. I took note how they would focus on one data point and hit hard at that one point on the poster or billboard. Also with how they used text and color to grab your attention.
After looking at the space that I would be provided in the Data Stacks install. I needed to create a space inside a box frame and created three wall pieces with a bottom piece that would be the ground for the egg sculpture. I measured the space and grabbed some supplies at the store. I cut out a plastic board in the measurements needed and used that as my base. I then used a foam sheet to cover the plastic board. I chose different shades of blue to represent the different shades of water. In representing the huge percentage of water usage that goes to agriculture and landscape I put artificial grass with a white picketed fence wrapped around the walls. I wanted to show the irony of how much of California’s water goes into maintaining these fenced off areas. I also placed the artificial grass in stripes on the walls like blinds to create a sensation of peaking into the data and space. As the egg sculpture grabs your attention and brings you in to read that data that is presented in on the back wall that shows how the data is translated on the egg sculpture with the title and the pie chart with the information of the data built with the same cotton balls on the egg sculpture. My goal is to bring in observers into a visual space of data and encourage them to look and feel the data of California’s water usage.
Citation:
Walker, Richard A., and Suresh K. Lodha. The Atlas of California: Mapping the Challenge of a New Era. Berkeley: U of California, 2019. Web.
Tallman, Susan. “Guerrilla Girls. (Prints and Editions).” Arts Magazine 65.8 (1991): 21-22. Web.
Guerrilla Girls. The Guerrilla Girls’ Bedside Companion to the History of Western Art. New York: Penguin, 1998. Print.
Schechter, Joel. Satiric Impersonations: From Aristophanes to the Guerrilla Girls. Carbondale: Southern Illinois UP, 1994. Print.
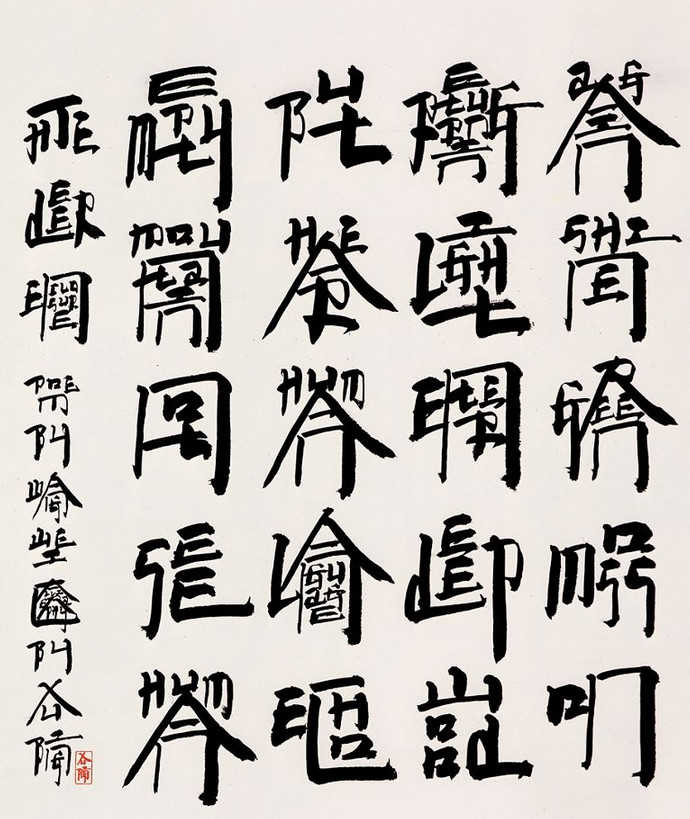
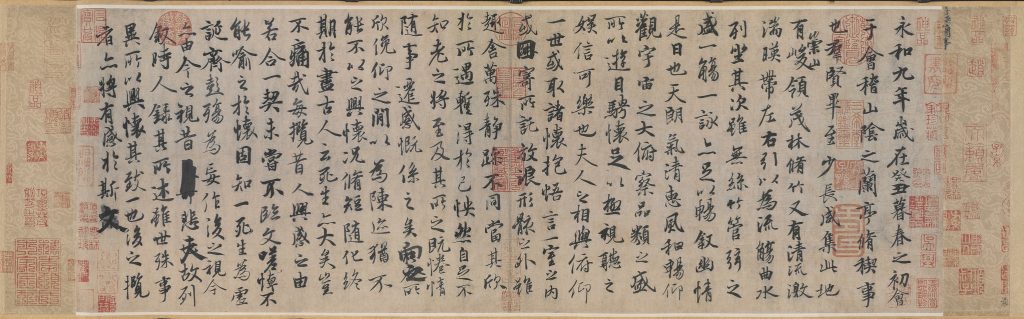
At the beginning, I wanted to make an art form similar to traditional Chinese calligraphy in my final project, like this one.
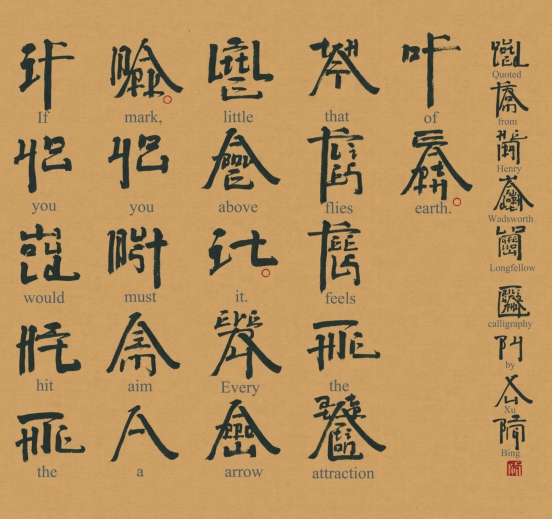
It is difficult until Yao tell me he knows an artist named Xu Bing who created a character that made up of English character but look like Chinese character. Like this:
It is so cool! I know that is what I want to do. Therefore, I invited Yao to do this project together. At first, we recreated 26 English letters to make it look like part of the Chinese characters. Then I use these English letters to combine to English words one by one. It was a very complicated process, but fortunately, we did a good job. The hole thing is here:
We also want through our character to show some data. Therefore, the sentences we write in our own new English are an introduction to Chinese characters, and at the same time, we find the evolution of several representative Chinese characters from ancient to modern times, hoping to let people who watch our works know the origin and charm of Chinese characters. In the end, we arranged these elements in the form of the traditional Chinese calligraphy I mentioned at the beginning to get our final product.